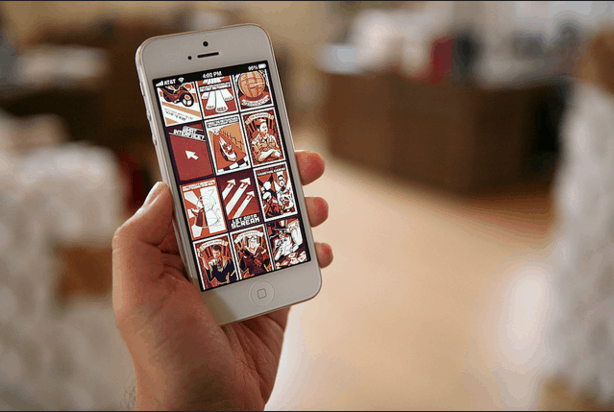
Among the more available visual content online, infographics are extremely prevalent information resources online, especially via mobile devices. Businesses maximize infographics for marketing purposes by making complex research and data easier to understand through a single visual content containing important information with interesting images.
As mobile devices become a vital tool for consumers and businesses alike, consuming information such as an infographic will be a lot easier while on-the-go. The static infographic format will be the most popular implemented next year, according to the list of future trends in 2016. This infographic format is easy to share and view on social media platforms even via mobile devices.

Photo Credit: juhansonin via Compfight cc
Mobile technology is not only changing the infographic landscape, various industries have started adopting mobile technologies and its additional functions. The retail industry was among the first to adopt the technologies. Worldpay mentioned that the countertop card machines, the most widely used payment system in the world, now has contactless technology built-in that accepts payments from the user’s mobile device. Thus, it’s not at all surprising to see a massive increase in the consumption of infographics via the small screen of mobile devices as well.
But, viewing a large image full of information is not that simple on a small device. There are various adjustments that need to be done, such as ensuring that the image is mobile optimized and responsive on smaller screens. It guarantees that the infographic isn’t too hard to read, not too difficult to navigate, and doesn’t require zooming in and out to view the information clearly.
Additional tip: If the infographic on a PC is too large to be optimized for a smaller screen, consider creating separate and shorter infographics about each major point. It might help to make the introduction and ending blurb shorter and straight to the point. Make sure each piece is optimized for social media platforms.
In Edward Tufte’s 1983 landmark book (The Visual Display of Quantitative Information), he defined the core elements of a ‘graphical display’:
• Must present data up front
• Encourage the viewer to think about the substance of the content
• Prevent distorting the message of the data
• Show as many numbers in a small space while staying coherent
• Induce the eye of viewers to compare various pieces of data
In general, Tufte said the most important element is for the infographic to condense large amounts of data and information into a form where viewers can easily absorb it.
What do you think the future of infographics will be? Do you expect wrist wearables and smart watches to be able to view this type of visual content soon? We’d love to hear your thoughts. Feel free to leave us a comment below.
