Infographics are a great visual tool to summarise knowledge and data on any given
topic. They have been popular for a few years now, with thousands available for our
viewing and knowledgeable pleasure. Now with us living in a world with more data being
collected than ever before, what does the future hold for infographics, and what future
trends can we foresee for 2016?
When did infographics become popular?
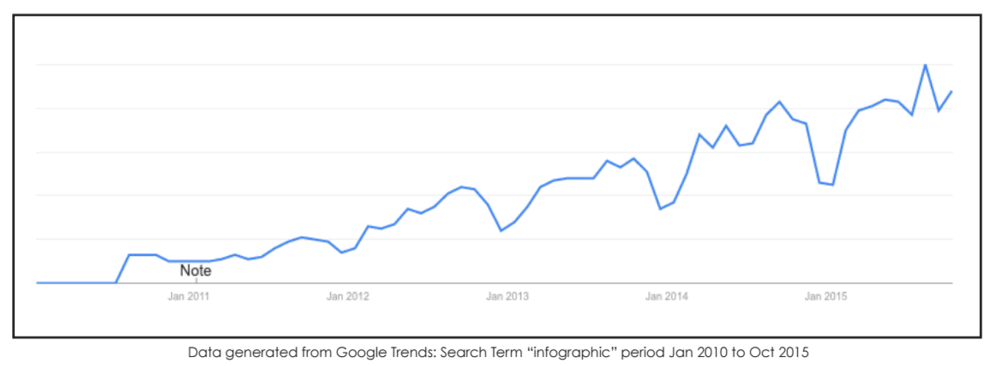
According to Google Trends, the search term “infographic” started rapidly becoming popular in January 2011 and is still on the rise. The most viewed infographic on visuall.y is “What are the odds?”, shared in November 2011 and currently holding 1.8M views.
Why are infographics popular?
I believe infographics are continually popular because we live in a fast-paced world filled with information at our fingertips. We have more data being generated, tracked and consumed than ever before; even with everyday consumer items such as smartphones, fitness trackers and the Apple Watch. A good infographic displays information in such as way that the viewer can quickly comprehend the message, with clear points in a visually appealing way. According to “The Power of Visual Content” infographic by Market Domination Media, it’s proven that visuals are processed 60,000 times faster than text, and 90% of information transmitted to the brain is visual. A good infographic will capture a viewer’s attention and draw someone into click to read further. It needs to be about something that catches their interest, visually appealing and useful. The title and the colour scheme really needs to be designed well. For an infographic to be successful, the winning formula is to select a relatable and interesting topic, quality research, tell a story, use good design with a complimentary colour pallet and clean typography.
FUTURE TRENDS FOR INFOGRAPHICS
The popularity of infographics will continue. With all this data being generated, being able to visualise this data is key. See below for my predictions on the upcoming trends for infographics in 2016:
Topics: Looking at the most shared infographics over the past year on Buzzumo, the topics are extremely varied; from The World’s Most Spoken Languages, to How Coca Cola Affects Your Body in 60 minutes. Infographics can cover any topic for the everyday reader, or can be a great marketing tool for branding or product information. Infographics will increase in popularity if the topics are interesting – topics that people can connect to and will be able to learn from.
Data: The collection of data will continue to increase. Data needs to be displayed in a such a way that the viewer can quickly comprehend what’s being explained. Infographics will continue their popularity, when they are not just “visual candy” but also with accurate data translated into clear and simple representation.
Static Infographics: Static infographics will remain the most popular format as it’s easier to design and more affordable to create and has a quicker download time. They can be used on print material, and easily shared and viewed via social media with mobile devices as well as desktop devices.
Interactive infographics: Due to the high number of static infographics, interactive infographics will become more popular. Interactive options include scrolling, click/roll-over to reveal more information, transitions or multi-page formats. They allow more engagement for the viewer for longer viewing times with the ability to provide more in-depth information. Whilst doing this, it also allows the viewer to explore the data on their own.
Motion Infographics: Using animation, illustration and kinetic text, the viewer can be taken through an explanation or presentation of ideas whilst being entertained. Motion Infographics will remain the least popular format in comparison to Static Infographics as they are expensive to produce, have to be very well written and designed to be successful to hold the viewers attention.
Images: A lot of infographics these days could be seen as illustrations rather than an infographics, sometimes taking more time to decipher the information than the accompanying text. The current images used for infographics mainly incorporate cartoon styles and flat icons. Whilst scanning through most recent infographics on visual.ly, most infographics will continue the flat icon style, but there will be more 3D graphic style designs and more use of photos in 2016.
Design: Now it is easy for anyone to create their own infographics with many user-friendly online applications, such as Venngage, Piktochart, Infogr.am and Easel.ly – with many templates to get anyone started. Although these tools make it easier for the user to create infographics, this doesn’t mean it will be well planned or designed. An overflow of poorly produced infographics will reduce their value, and perhaps the popularity in viewership. These tools can’t replace thorough research data and a talented, professional Infographic Designer.
FINAL THOUGHTS
The popularity of all infographic formats are still on the rise. The trends for 2016 will include more interactive infographics, photos and 3D illustrations with static infographics remaining the most popular. I don’t see that the online DIY infographic will tools take away the value of the infographic. People will appreciate the specialised skills needed to create a successful infographic, and will enjoy learning about many topics through infographics for many years to come.
Veronica Machon, freelance graphic designer and student at CATC Design School, looks at Future Trends for Infographics for 2016.
Full PDF of her report here.Infographic Future Trends for 2016_v1

